

Gathering mobility data over extended periods using wearable devices can provide a wealth of information with unprecedented levels of temporal granularity. However, it also presents a challenge – how can that information be distilled into clinically meaningful and stable values that adequately summarise mobility performance?
Before Mobilise-D, there were no standardised procedures for aggregating continuous digital health measures. A paper by Koch et al. (2026) recently published in npj Digital Medicine shows how the team in Mobilise-D produced the first aggregation framework for continuous walking data.
Why Aggregation Methods Matter
There are many advantages to measuring mobility in the real-world as opposed to short in-clinic assessments (such as the 6-minute walk test of timed-up-and go). Doing so is clearly more ecologically valid, as you capture how a person moves in their daily life. Measuring over extended periods of time can also capture natural variation in health due to fatigue, fluctuating symptoms, etc. We also capture different types of movement, from shorter walking bouts that occur indoors, to longer bouts of ‘purposeful’ walking outdoors.
This provides the potential for a host of different insights into health and function, but accessing them depends very much on how we aggregate the data. If we look at walking speed, using a simple average provides one view of a person’s mobility. Their fastest sustained walking provides another, while variation between walking periods may reveal something different again. The choice of which walking periods to include also matters. Short movements around the home differ from longer, uninterrupted walks. Combining them, or examining them separately, can change the meaning of the resulting measure.
The Mobilise-D Context
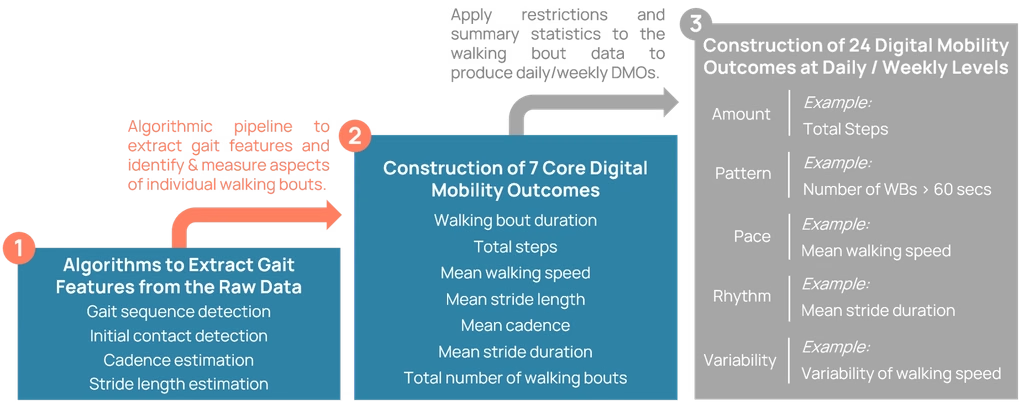
The Mobilise-D project developed an algorithmic pipeline to identify instances of walking within the raw data collected by a single wearable device placed on the lower back (referred to as ‘walking bouts’). The pipeline extracts gait features such as cadence and stride length and uses them to construct 7 core measures, known as Digital Mobility Outcomes, from these individual walking bouts (as shown in box 2 of the figure above).
The next step concerns the aggregation of that data into specific measures that can condense the information obtained at the walking bout level into DMOs that can characterise behaviour over longer periods of time, such as a day or week. These measures must provide single, clinically meaningful, and stable values that are suitable for within- and between-individual comparisons.
A framework combining statistical evidence and expert judgement
The team began by defining aggregation as the combination of two elements, restrictions (data segments relevant to the analysis such as a walking period greater than 30 seconds) and summary statistics, which condense parameters through measures of additivity (e.g., sum), extremes (e.g. 90th percentile), variability (e.g. standard deviation), or central tendency (e.g., mean).
They then developed a transparent, parameter-agnostic and standardized approach to aggregation that consisted of three stages. First, they identified candidate ways to aggregate the data. They had to be technically valid, interpretable and supported by sufficient observations. The distribution of the measurements also informed which summary statistics were appropriate.
Second, the candidates underwent statistical assessment. The researchers examined how consistent the measures were within individuals over time using intraclass correlation coefficients (ICCs), and how well they distinguish between relevant participant groups with area under the curve (AUC) analysis. Those assessments were repeated at different timescales (individual days and over the course of a week).
Third, experts reviewed the remaining candidates. Statistical performance informed the selection alongside existing knowledge, practical considerations and the intended use of the measure. This final stage recognised that a statistically strong result must also have a meaningful interpretation. Where several measures captured useful but different aspects of behaviour, retaining more than one was justified.
Applying the framework to everyday walking
The team applied its approach to seven days of wearable sensor data collected through the Mobilise-D project. The study included 2,181 individuals with and without mobility disabilities, and covered individuals with Parkinson’s disease, MS, COPD, congestive heart failure and proximal femur fracture.
Starting with seven underlying mobility measures, the researchers selected 24 aggregated outcomes with daily and weekly calculations. These covered walking activity, including the amount and pattern of walking, and gait characteristics such as pace, rhythm and variability.
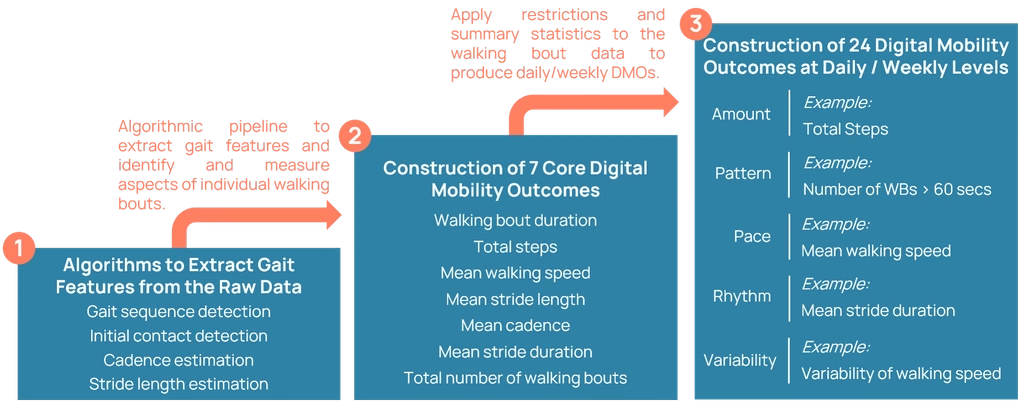
Many candidate measures showed strong consistency between days. Their ability to distinguish between participant groups, however, varied across measures and conditions. No single aggregation choice consistently performed best in every setting. The findings illustrate why the question being asked should guide the summary being produced. Different measures can reveal different aspects of the same underlying activity.
Conclusion
The achievement of the team in condensing extended periods of mobility measurement into 24 DMOs is a significant one. They showed that standardised procedures can be used to condense digital health data into clinically meaningful and statistically stable values. This will help researchers to truly harness the many benefits of real-world mobility data.
You can find more details about the 24 DMOs and our platform for providing them here, as well as information on the method in various white papers on our resources page.